Excel RTD
The Excel RTD app is a very adaptable trade monitoring, analysis and reporting tool which allows traders to interact with trading platforms using their Excel skills rather than having to learn complex programming languages.
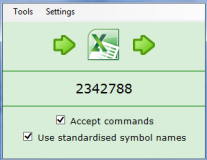
The app enables traders to do two distinct things:
- Put real-time account, ticket, and price data into Excel using only Excel's built-in RTD() function. No macros, no programming. Only standard Excel knowledge is required.
- Send simple trading commands from VBA code in Excel (or from any other language which supports COM).
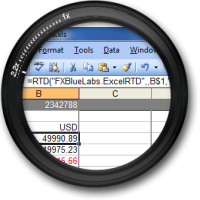
For example, once the Excel RTD app is running, the formula for displaying the equity on account number 123789 - updating in real time - is simply as follows:
Other examples of formulas include the following:
| =RTD("FXBlueLabs.ExcelRTD", , "123789", "bidGBPUSD") | Current bid price on GBP/USD |
| =RTD("FXBlueLabs.ExcelRTD", , "123789", "tickets") | Number of open positions on the account |
| =RTD("FXBlueLabs.ExcelRTD", , "123789", "t1pl") | Floating P/L of first open position on the account |
| =RTD("FXBlueLabs.ExcelRTD", , "123789", "@bh,USDJPY,H1,high,0") | High of current H1 candle on USD/JPY |
| =RTD("FXBlueLabs.ExcelRTD", , "123789", "@ema,EURUSD,M3,median,21,0") | 21-bar EMA of median price on EUR/USD M3 candles |
Traders can build simple spreadsheets, without programming, which display and analyse account and price data in real-time. They can also build a single spreadsheet which compares data across multiple accounts.
Like any cells in Excel, the RTD data can be linked to a chart, or to conditional formatting - for example, highlight losing trades or accounts in red. Therefore, sophisticated traders who have built market models in Excel can use the app to combine the model with real-time prices (and open-position data), using standard Excel features to notify themselves when positions should be opened or closed.
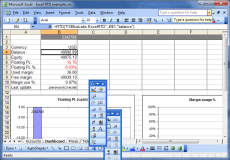
The Excel RTD app is supplied with a user guide and also an example spreadsheet. Using nothing other than the RTD() function described above, this example spreadsheet demonstrates how to implement a complete trader dashboard with charts showing the floating P/L on multiple accounts, price comparisons, and a combined ticket list for multiple accounts.
VBA programming
Traders with minimal knowledge of VBA programming can also use Excel to send simple trading commands (or to read data) using code such as the following, which could be linked to a button on a spreadsheet:
strResult = cmd.SendCommand("123789", "BUY", "s=EURUSD|v=10000", 5)
In other words, traders with basic programming skills can use Excel for anything from constructing their own customised deal ticket through to automated trading based on a financial model in Excel.
The ability to send commands and read data can in fact be used from any programming environment which supports COM, not just Excel VBA. For example, a trader could create anything from a simple .vbs script which closes all positions through to a complex trading algorithm written in C#, both of which place trades by sending commands to the Excel RTD app.
Video
FX Blue Labs can provide videos about each app. Broker clients can either use generic un-branded videos, like this example, or can commission branded versions which FX Blue Labs will arrange and pass on at-cost from the video company.
Availability
The app is available for the following platforms:
 MT4 MT5 xOpenHub cTrader JForex Protrader 3 FXCM TS2 Oanda
 Vertex (available for testing)