Session Map
The Session Map gives the trader a quick market overview, including the current status of their account.
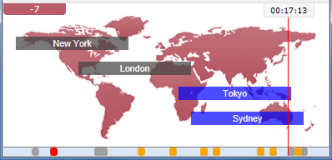
World markets
The app's main display is a map showing the main world markets and a representation of the trader's local time (according to their computer clock). However, the Session Map also includes a number of other elegant features.
Economic calendar
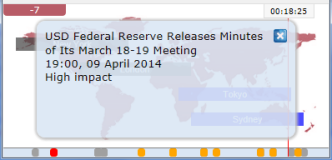
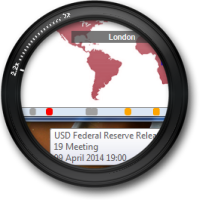
The bar at the bottom of the Session Map shows future events in the economic calendar, colour-coded by probable impact. Traders can get a quick description of each news event by hovering the mouse over the marker in the bar, and they can read the full description by clicking on the marker.
Key market changes
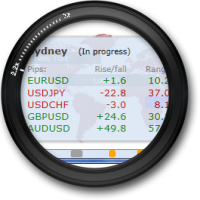
The Session Map can also display information about price movements in key markets during the current session or a previous one. For each of a list of major symbols, the app displays the following information about what has happened in the session so far (or at the end of a completed session):
- Rise or fall during the session, in pips
- Total trading range during the session, in pips
- Closing price - or current price for an in-progress session
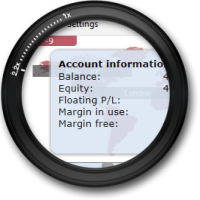
Account data
As a further refinement, the Session Map also shows the status of the trader's account. The world map is colour-coded depending on whether the trader is in profit or loss, and any floating P/L is shown in a marker at the top of the map. Clicking on this marker displays key account metrics: equity, balance, margin usage.
Video
FX Blue Labs can provide videos about each app. Broker clients can either use generic un-branded videos, like this example, or can commission branded versions which FX Blue Labs will arrange and pass on at-cost from the video company.
Availability
The app is available for the following platforms:
 MT4 MT5 xOpenHub cTrader JForex Protrader 3 FXCM TS2 Oanda
 Vertex (available for testing)