FX Blue Labs can provide informative, attention-grabbing price widgets for use on your own website, ranging from simple quote-boards through to sophisticated views such as heat maps. All the widgets use your own prices, not a generic price feed.
The widgets automatically resize to fit whatever container you give them, and all of them can be customised. The widgets can altered by your own design team, using parameters in the widget's URL, without needing to request bespoke work from FX Blue Labs.
With the exception of market depth, all we need from you in order to set up the widgets is a non-expiring demo (or live) account. You then include the widgets on your own website using simple iframes.
Most of the widgets are available in multiple languages. You can specify the language to use in the widget's URL, or it can be automatically detected for each site visitor based on their browser settings. As an example, the Session Map below has been set to display in Japanese.
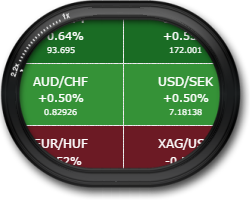
Market heat map
The Heat Map is a comprehensive, multi-featured overview of market changes and moves. You can either include the full widget on your website, where the user can switch between different views and filter the list of symbols (the example on the left), or you can choose to display only one fixed page from the widget (the example on the right).
Quote board
The simple version of the quote board shows current bid and ask prices, plus the spread, with markers each time a price moves. The list of symbols can be configured via the widget's URL; you do not need to request bespoke work in order to modify the symbol list or use multiple copies of the widget with different symbols in them.
Quote board with high, low, and day's change
The full version of the quote board shows not only current ask and bid prices, but also the day's high and low, and the percentage change from yesterday's close.
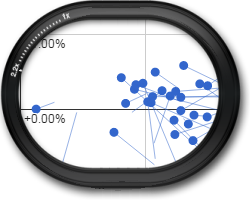
Live spread chart
The spread chart shows a graphical representation of your current spreads on selected symbols:
Price widgets
The price widget shows the current ask and bid prices for a symbol, the percentage change since yesterday's close, and the current price in relation to the high and low for the day.
Session map
The Session Map shows the user their local time in relation to trading sessions around the world. The bar at the bottom of the map shows events in the economic calendar over the next 24 hours, and users can hover over or click on these markers to see a description of the event. In addition, users can click on a bar such as Sydney or New York to get a summary of trading activity on key instruments during that session.
The Session Map is also available as an app which traders can run on their own computer.
(Please note that this widget has been deliberately set to display in Japanese, as an example.)
Aggregated news feeds
The News Feed widget can combine multiple RSS feeds and display them as a single stream - in this example, a combination of FX Blue Labs' Price Action News plus feeds from Forex Factory and Daily FX. If you have a licence to use a premium feed which is not available as RSS, e.g. BörseGo's Jandaya feed, then it is often possible to display these as well - subject to the provider's licensing terms.
The design of the widget can be tailored to match your website, and it is also possible to filter the combined feed so that it only displays items which contain particular text such as "EUR/USD".
Sentiment
FX Blue Labs can provide real-time market sentiment from the www.fxblue.com website, showing the percentage of real-money accounts which currently have open long or short positions in an instrument.
The sentiment is also available as an app which traders can run on their own computer. For more information about the sentiment data, please see the information about the app.
| EUR/USD | GBP/USD | AUD/USD | USD/JPY |
Swap rates
The swap-rate widget shows the swap rates for selected symbols. It can also be configured to display the difference between the long and short rates, and the sorting can be turned off for brokers who prefer a static table.
Market depth
FX Blue Labs can collect market depth information from your liquidity provider, and display it both on your website and in our Mini Terminal and Trade Terminal apps.
For more information, please see the separate page about market depth.